2025 Ultimate Coworking Space Data Report


2025 Ultimate Coworking Space Data Report
This report spans over 300 slides of charts and visuals. It covers micro spaces located in villages as well as large facilities in cities with millions of inhabitants. Many aspects of the coworking space landscape are included: space sizes, vacancy rates, revenue streams, member profiles, business models, spatial distribution, operational challenges, long-term goals, and “Space-as-a-Service” offerings.
The report describes how these features differ across the industry. It shows group comparisons by size, region, business model, and many other characteristics. Readers get a clear breakdown of market diversity and key characteristics that describe coworking spaces today. The table of contents makes it easy to find the data and topics most relevant to your research or interests.
‘Ultimate’ means ultimate: Inside the report, you’ll also find a voucher for the 2025 Global Coworking Trends Report included at no extra cost.
Please download the report within 24 hours of purchase. The file size is 7 MB.
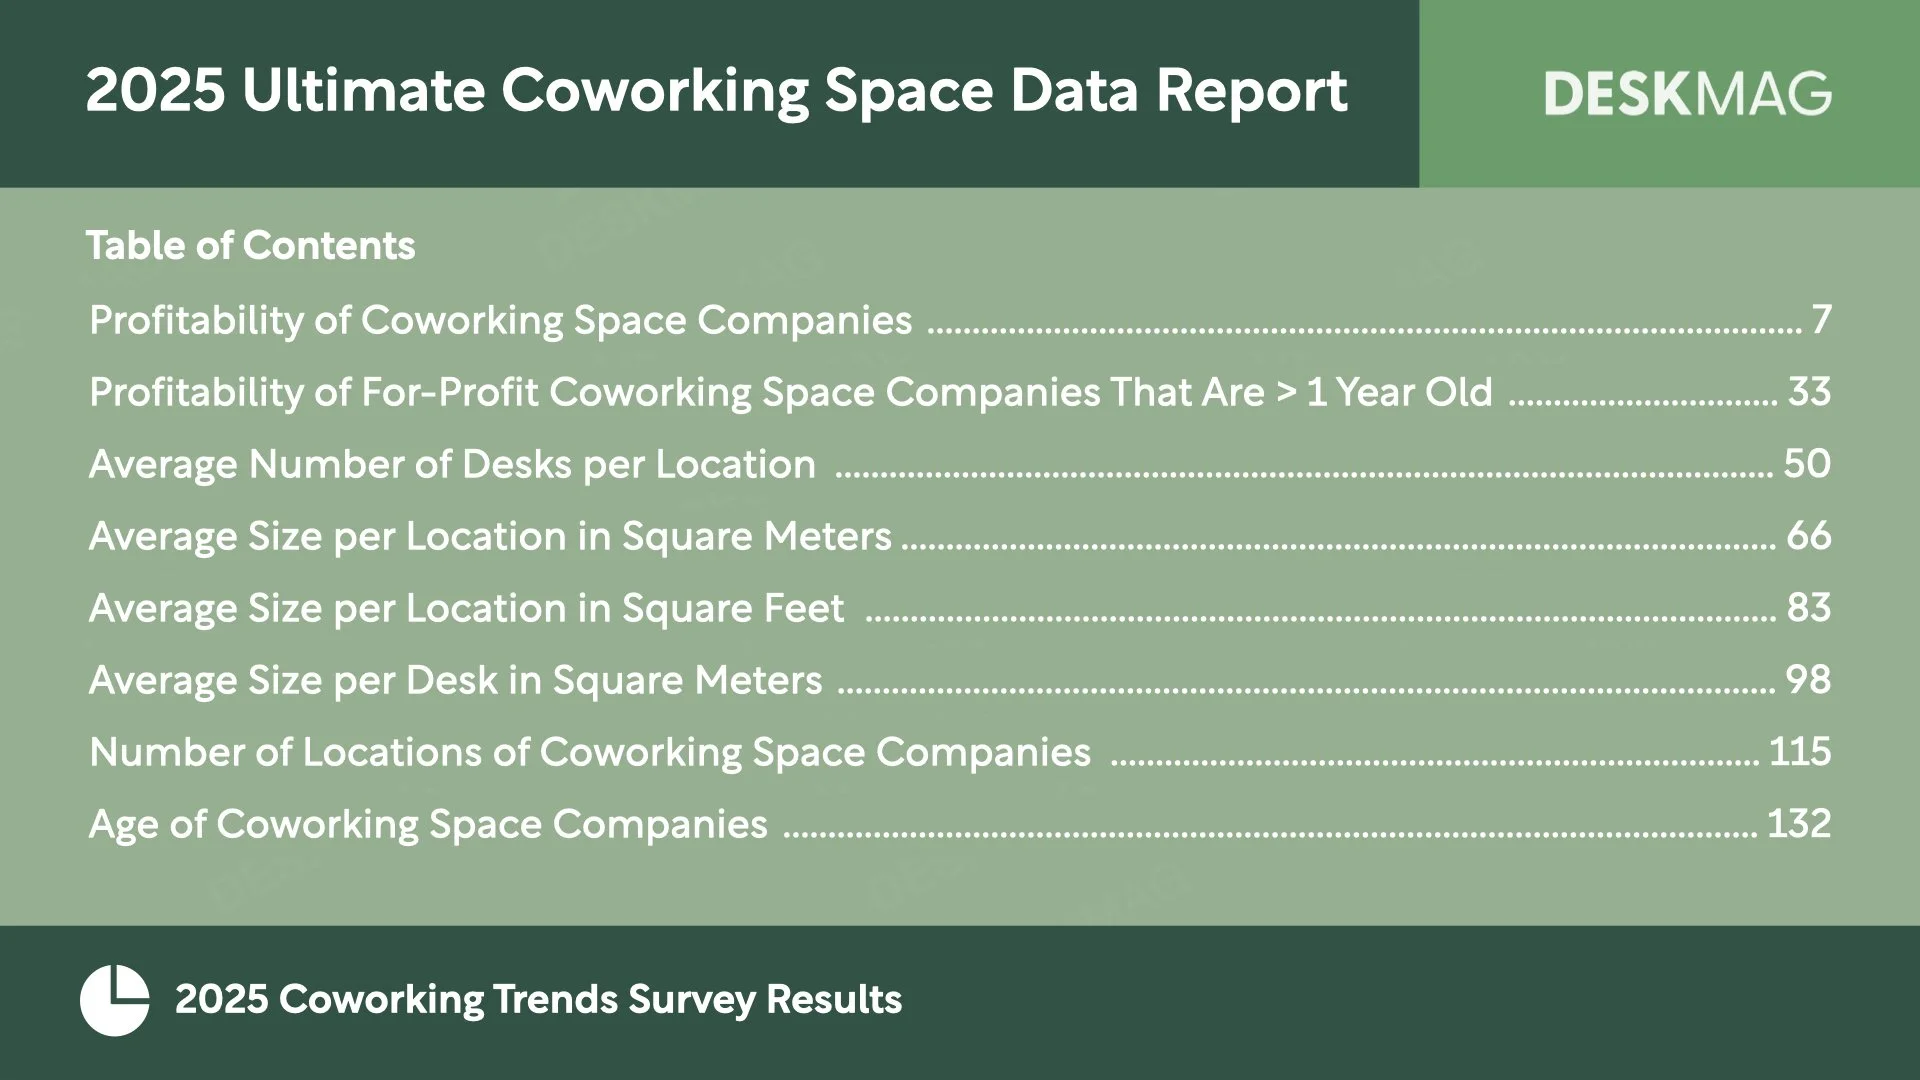
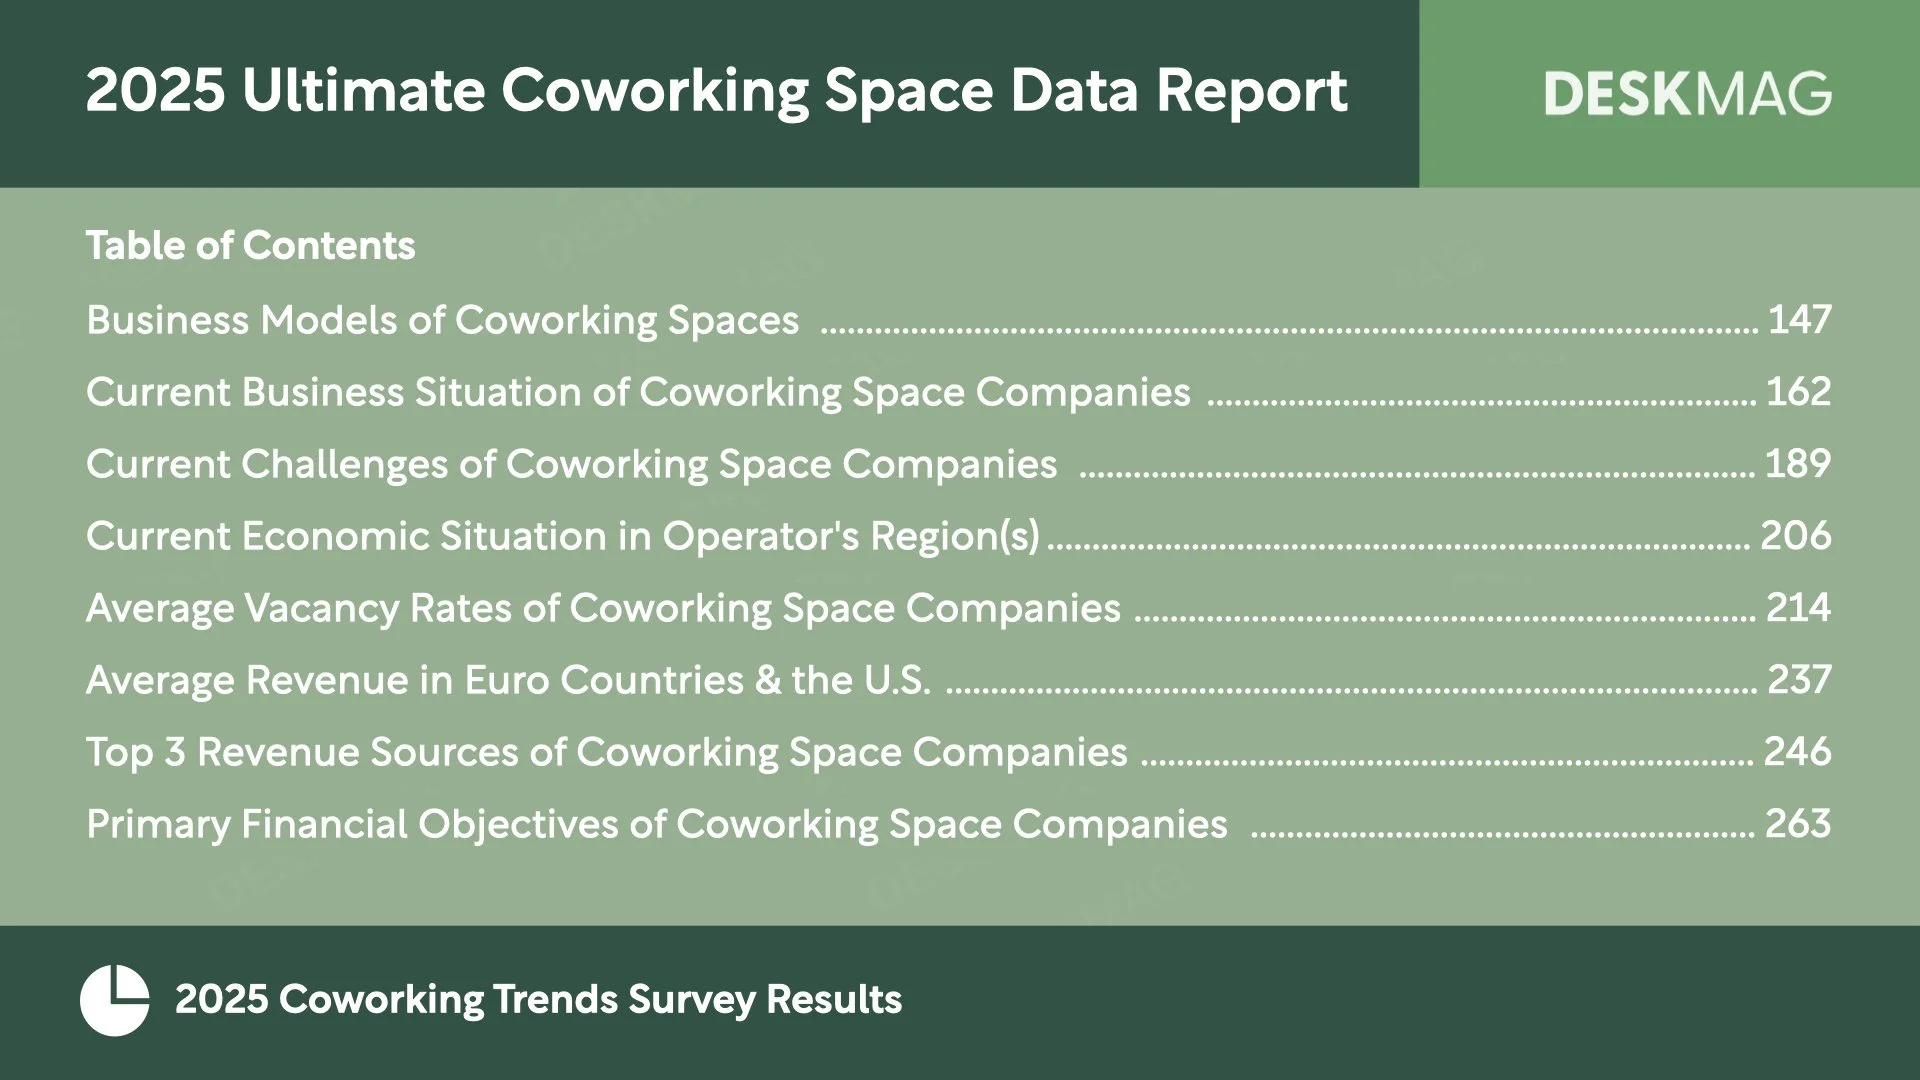

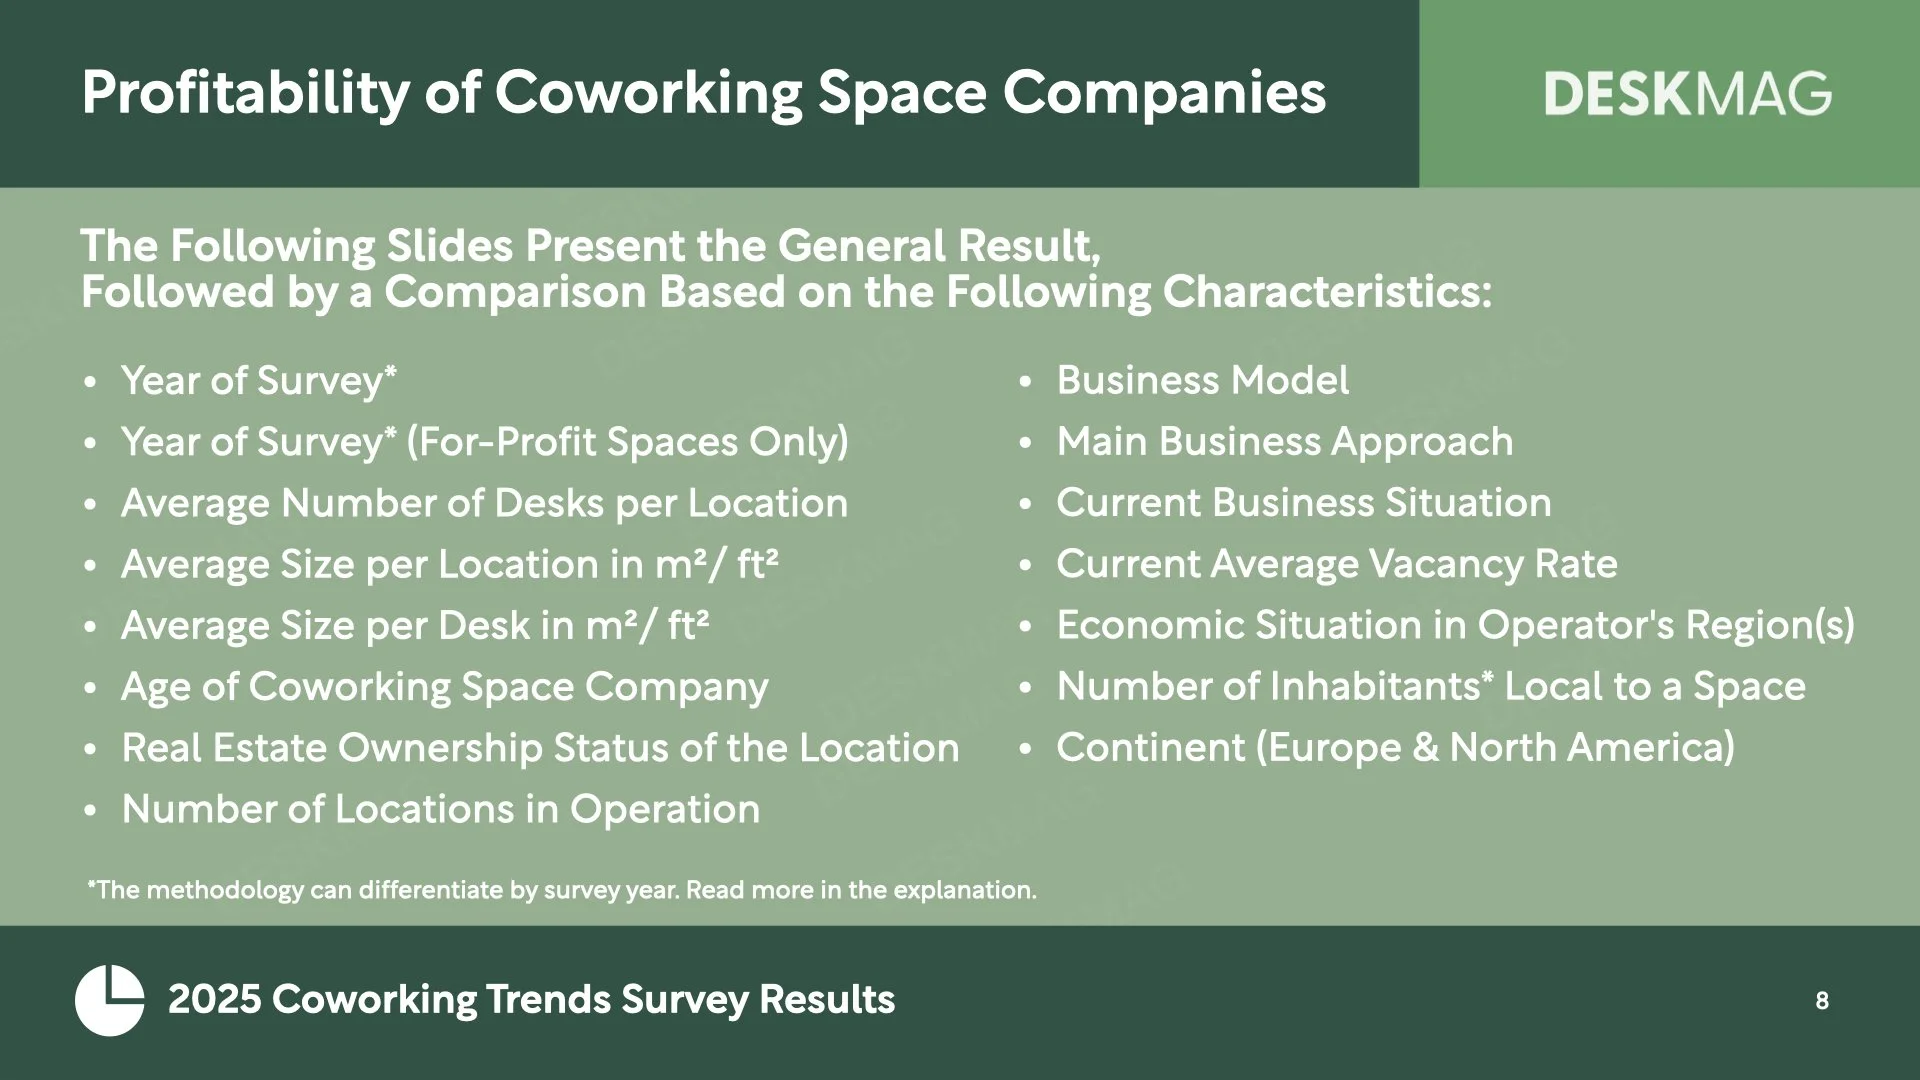

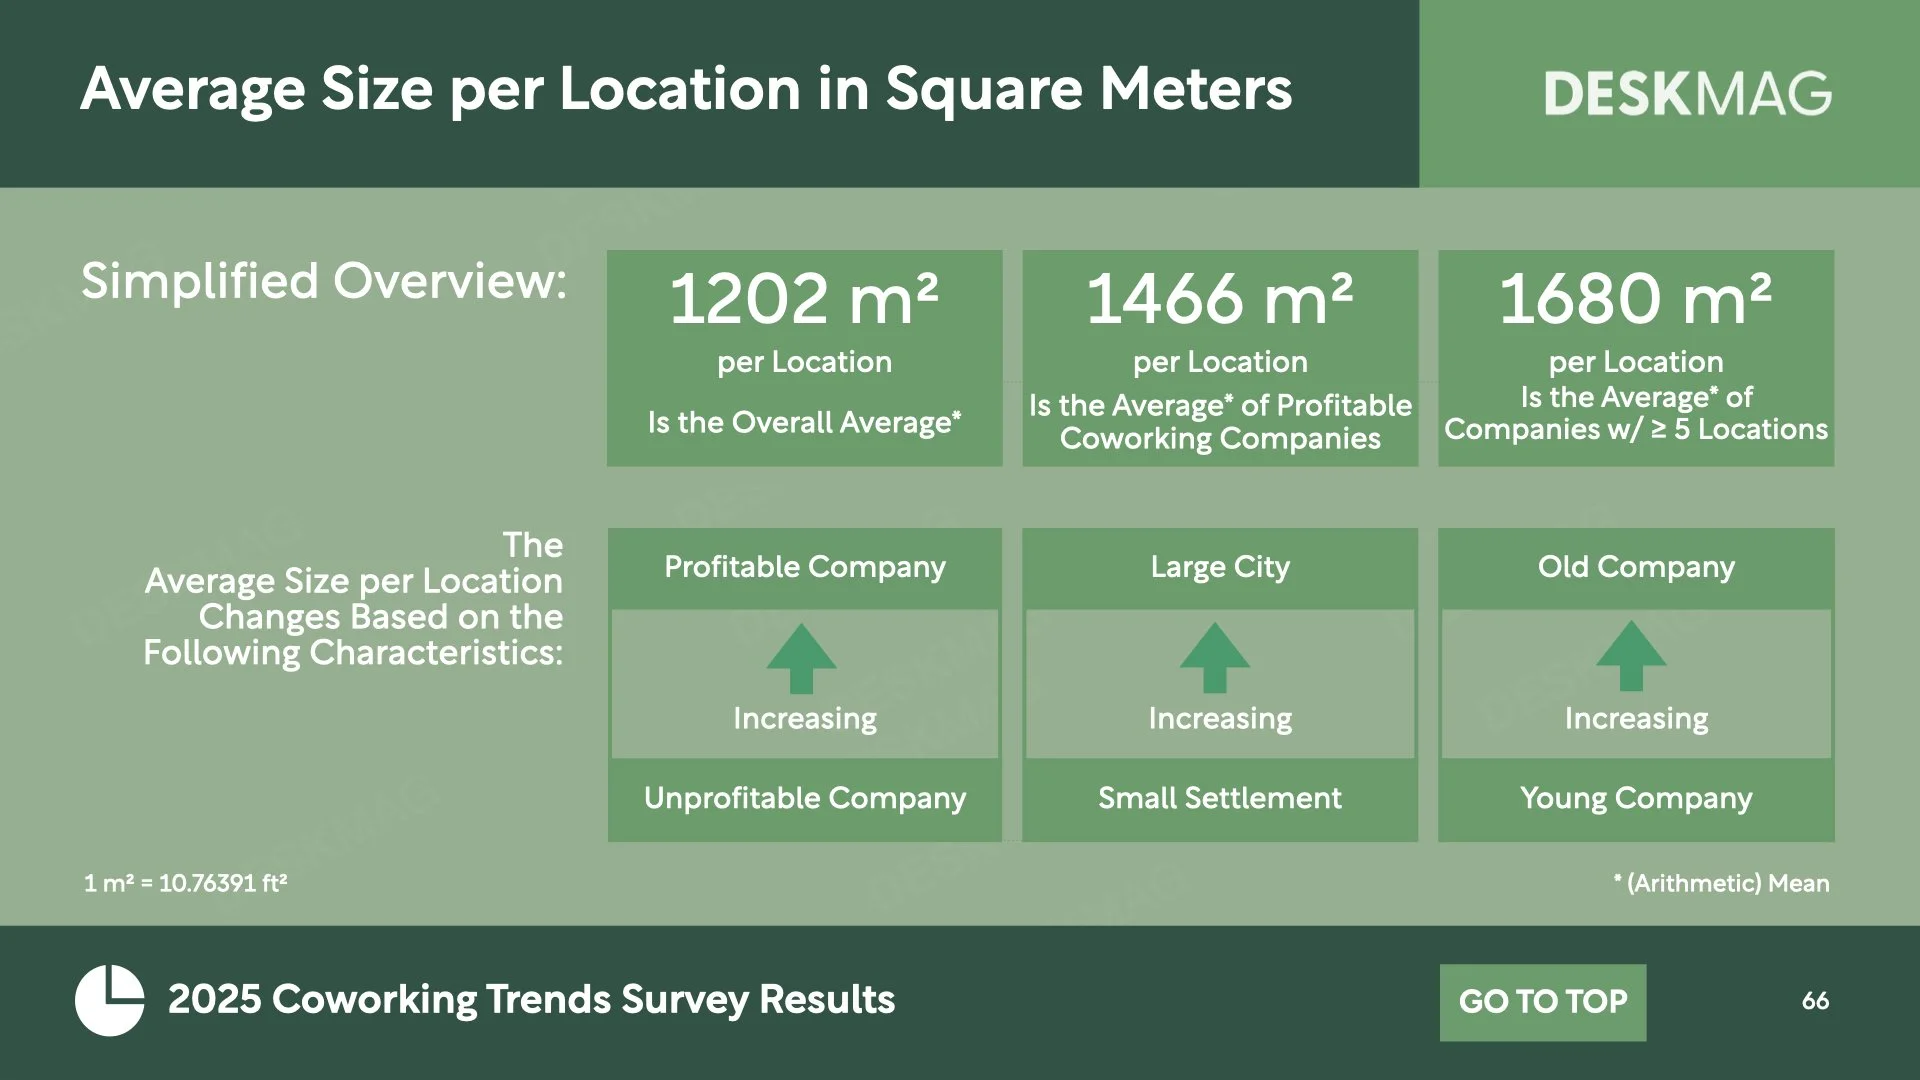
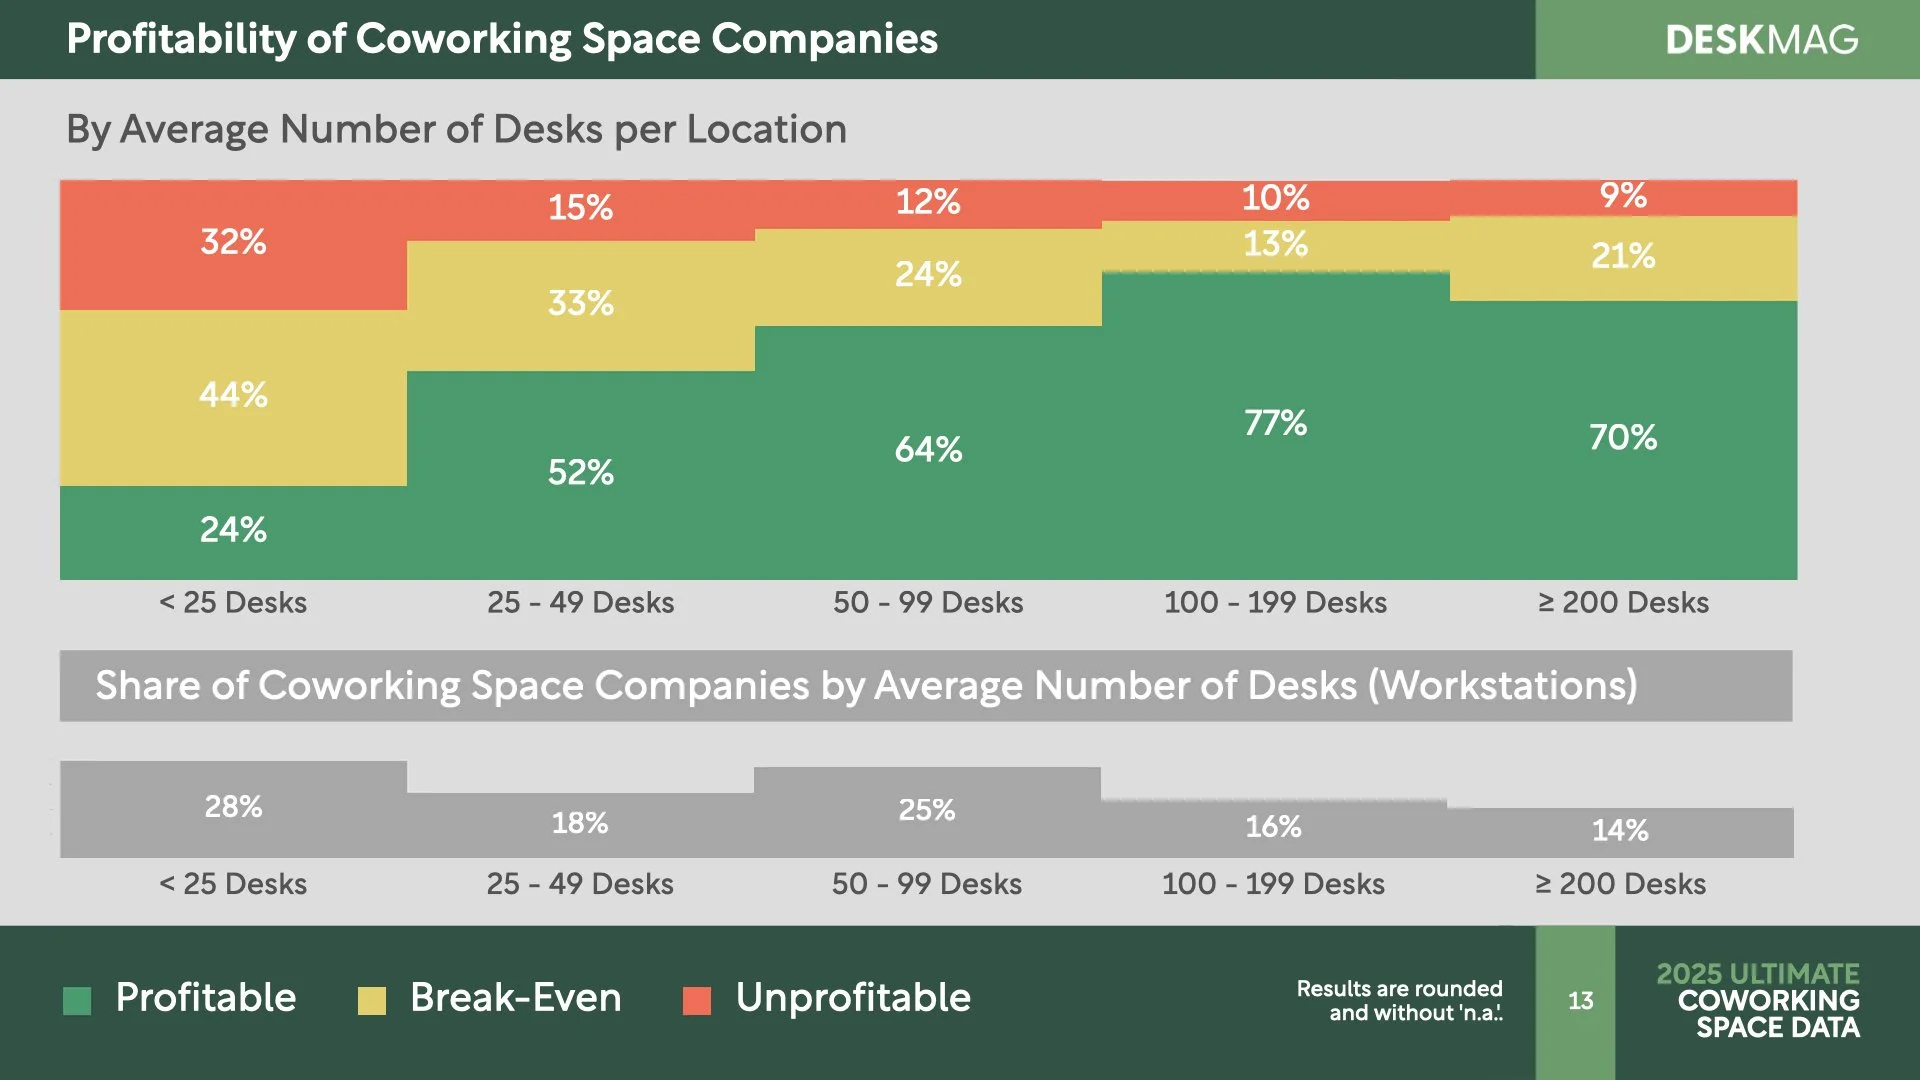

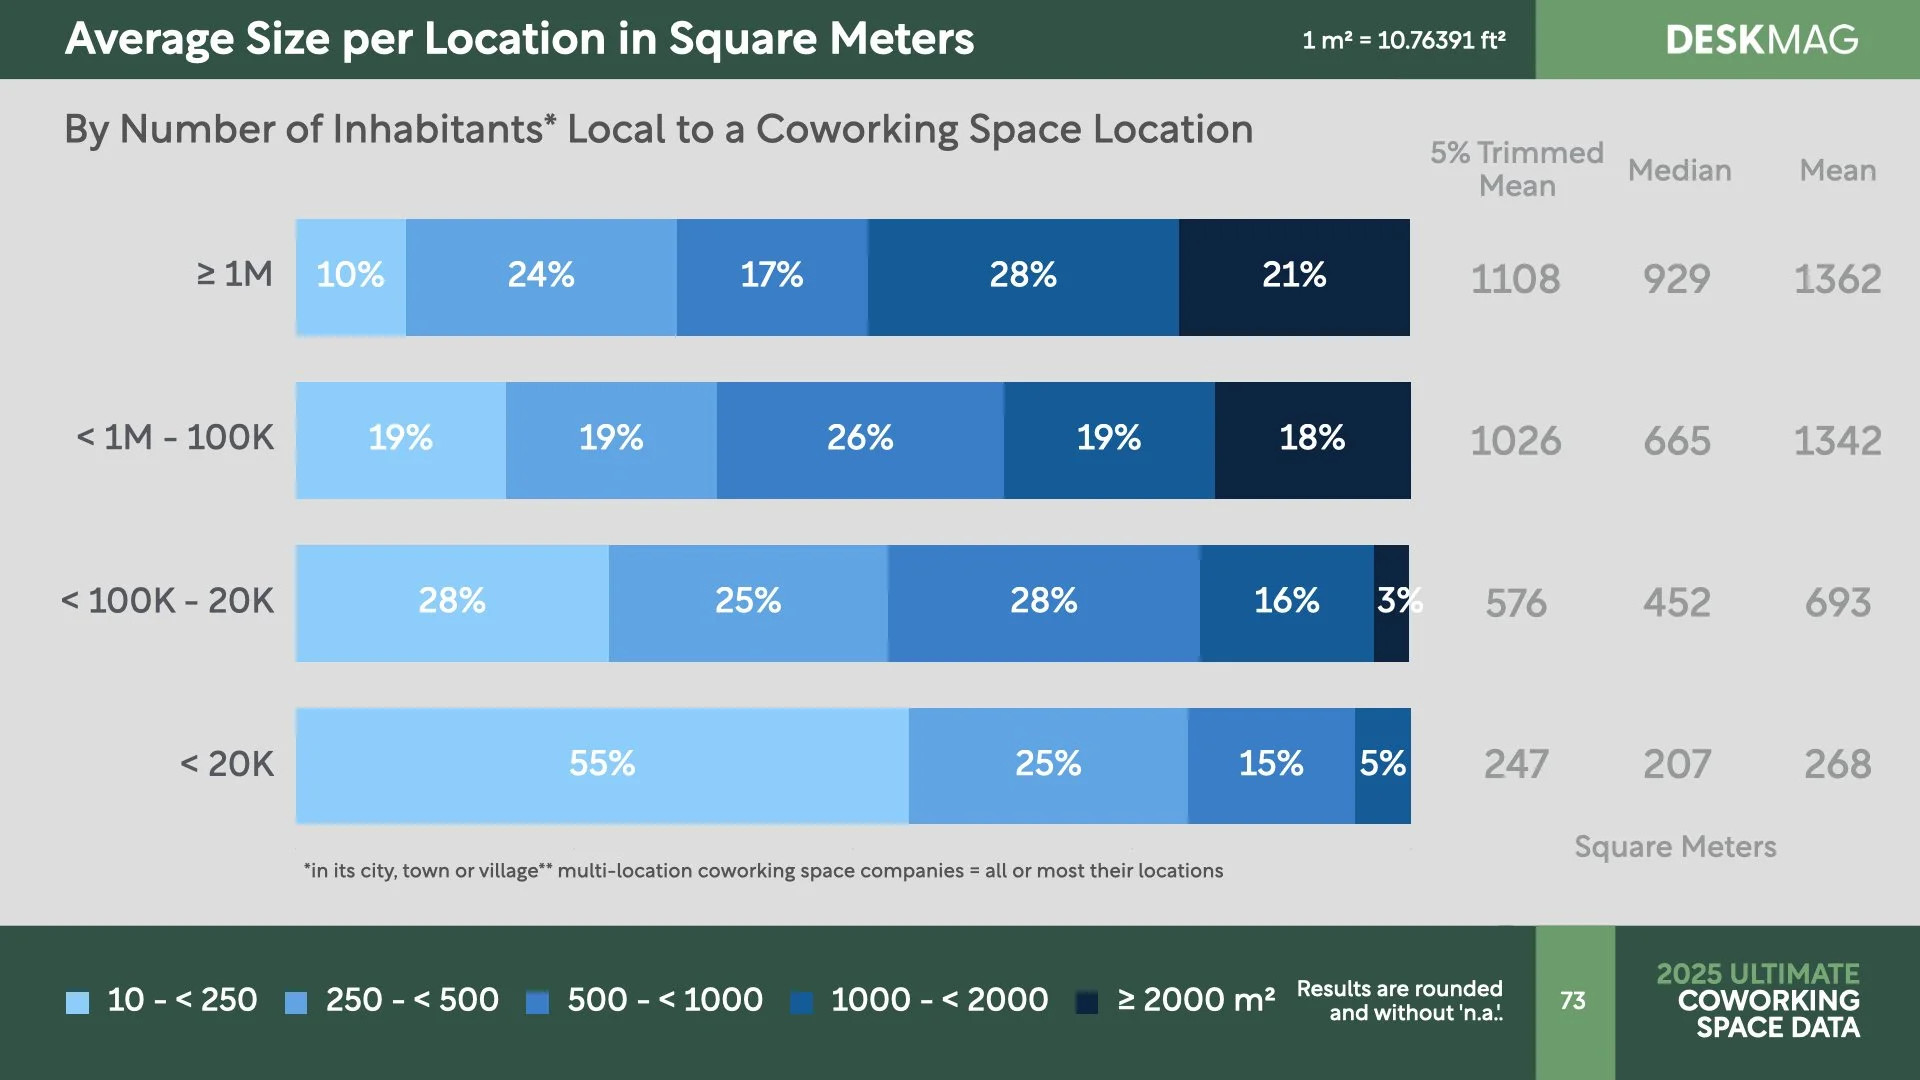
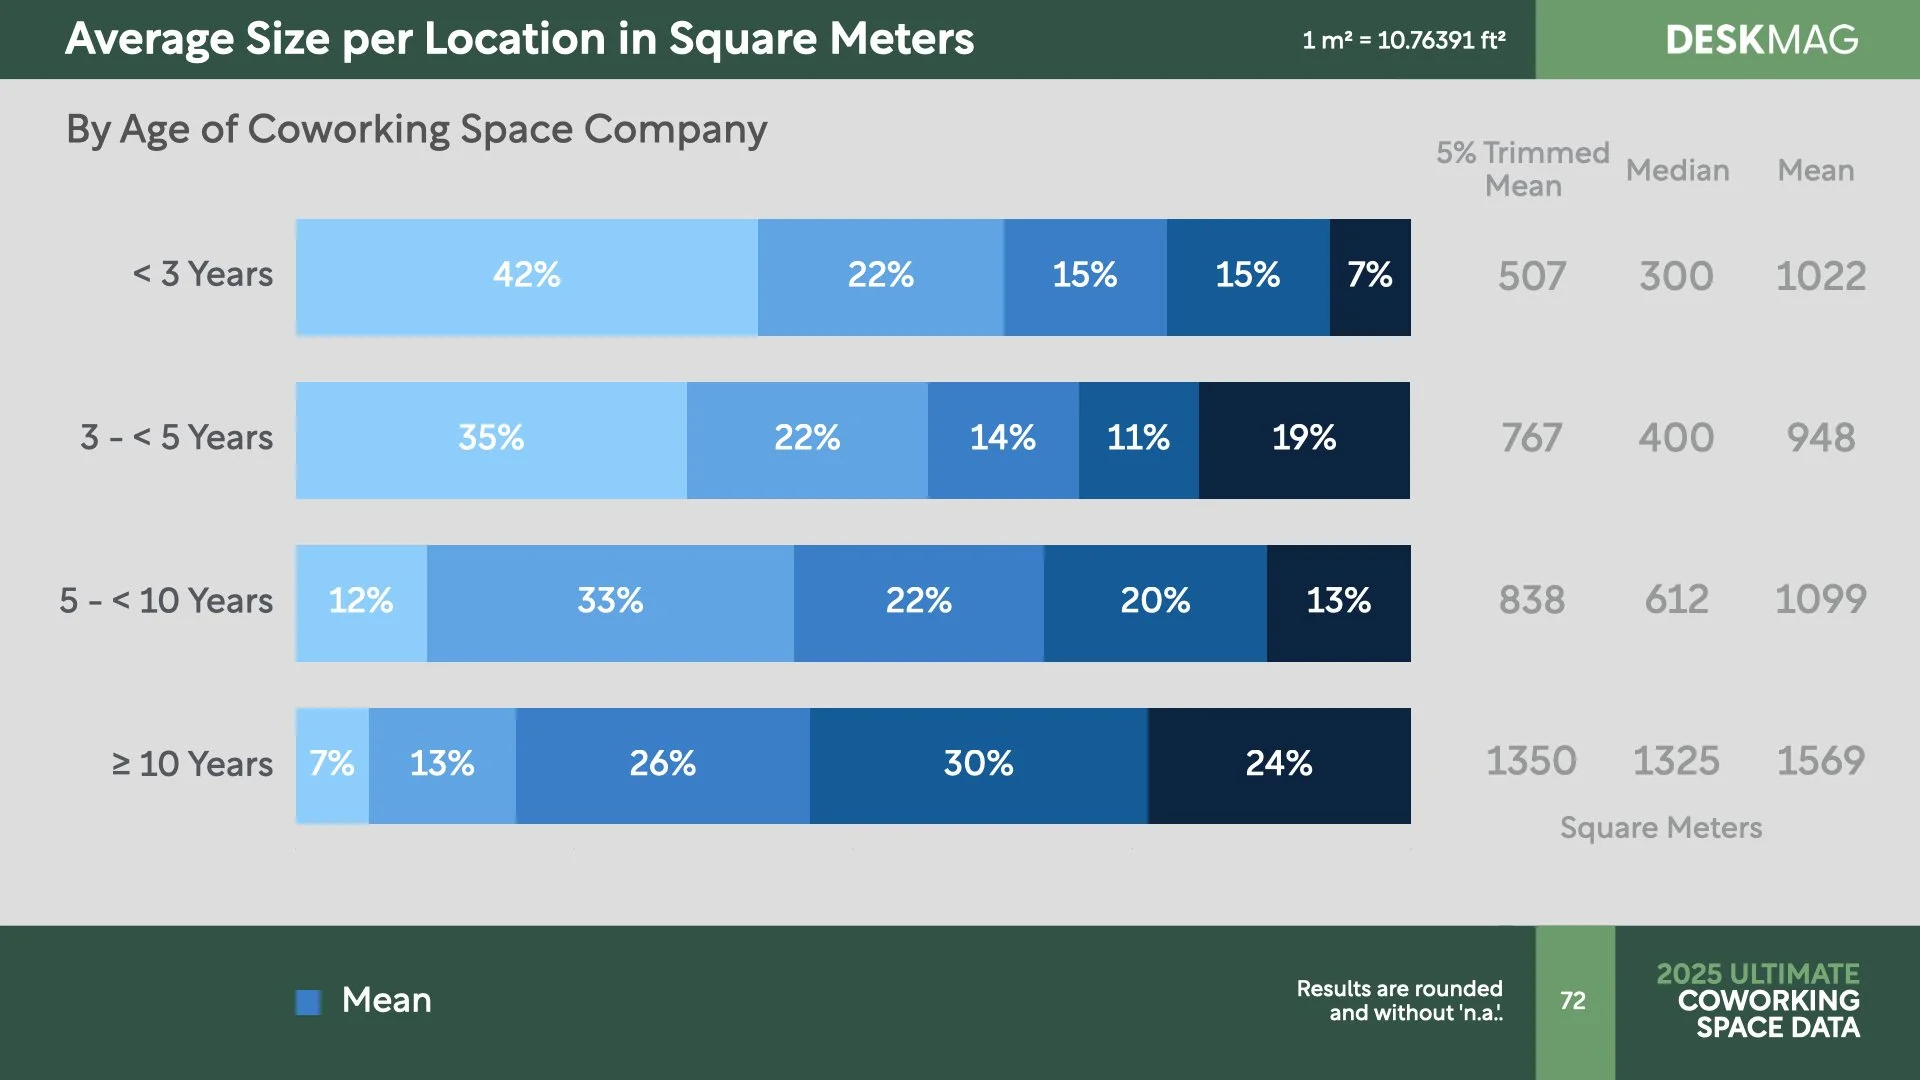
Table of Contents:
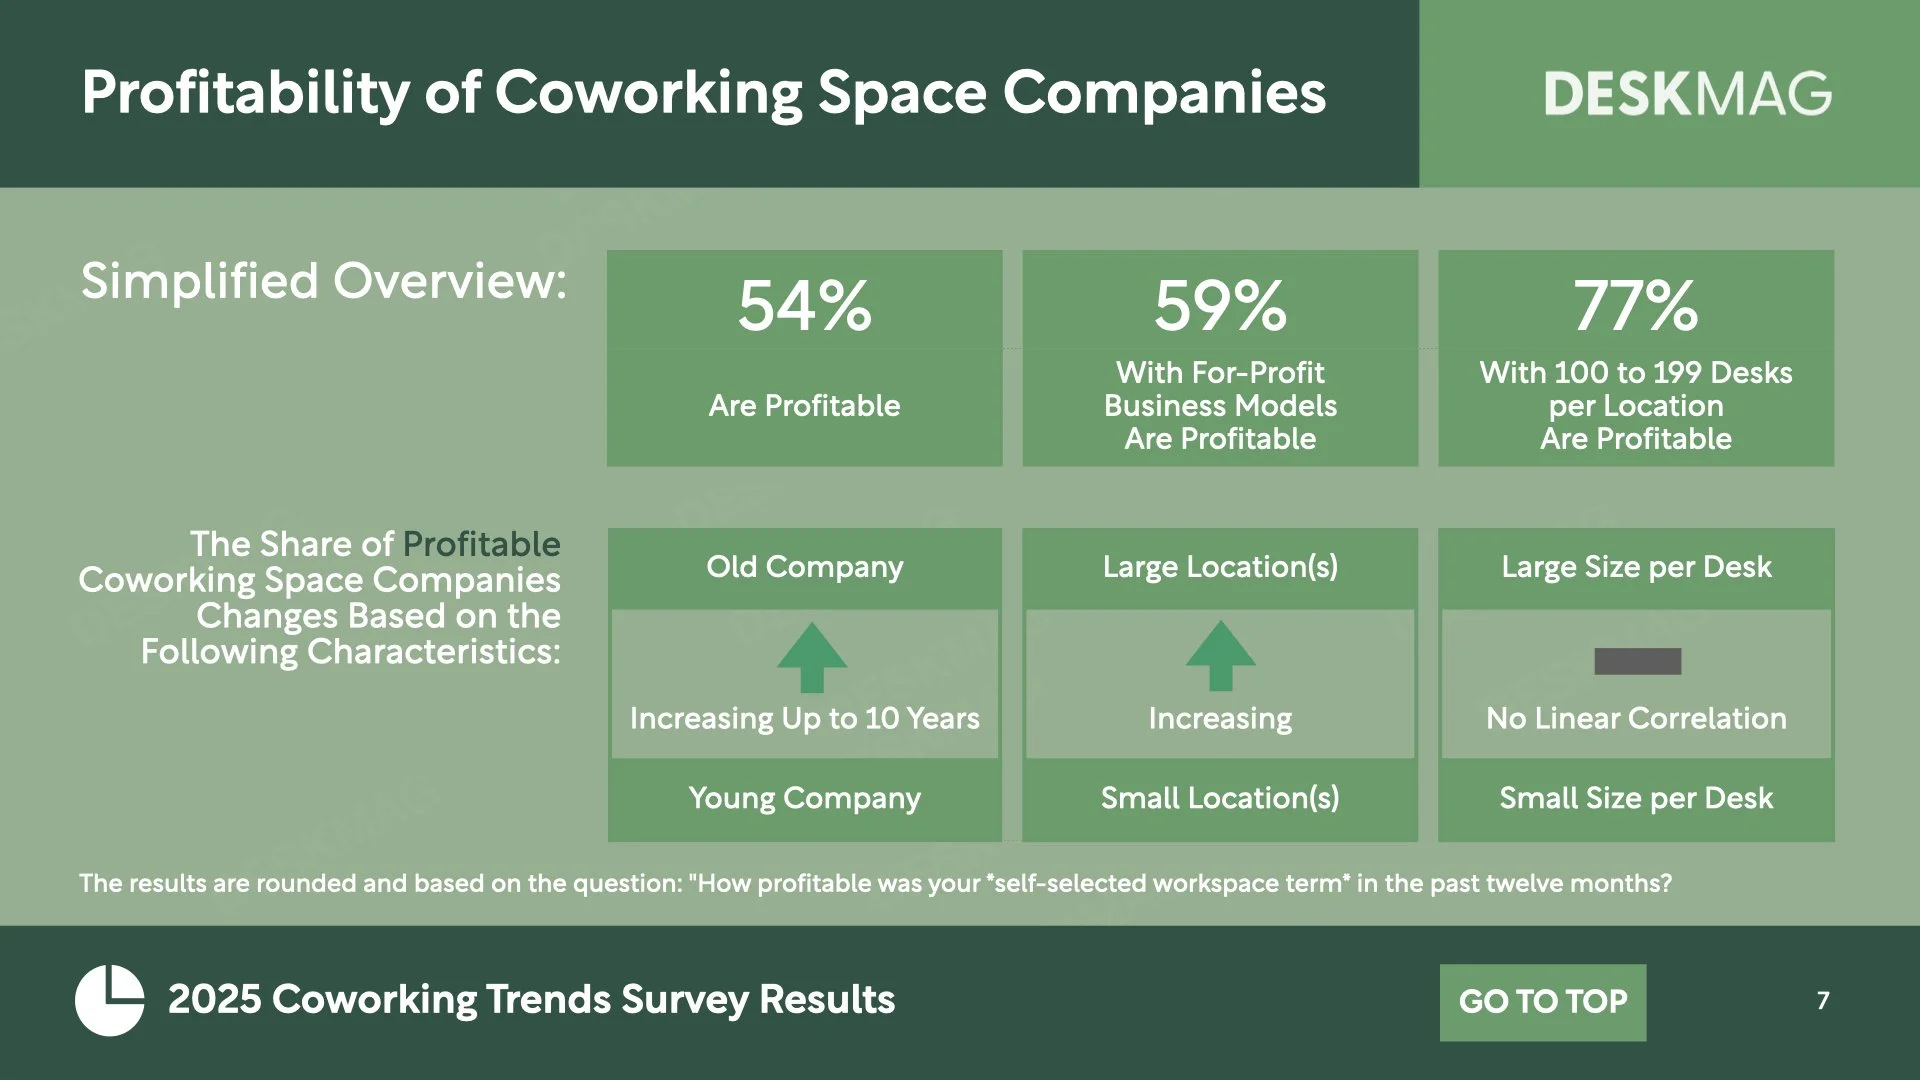
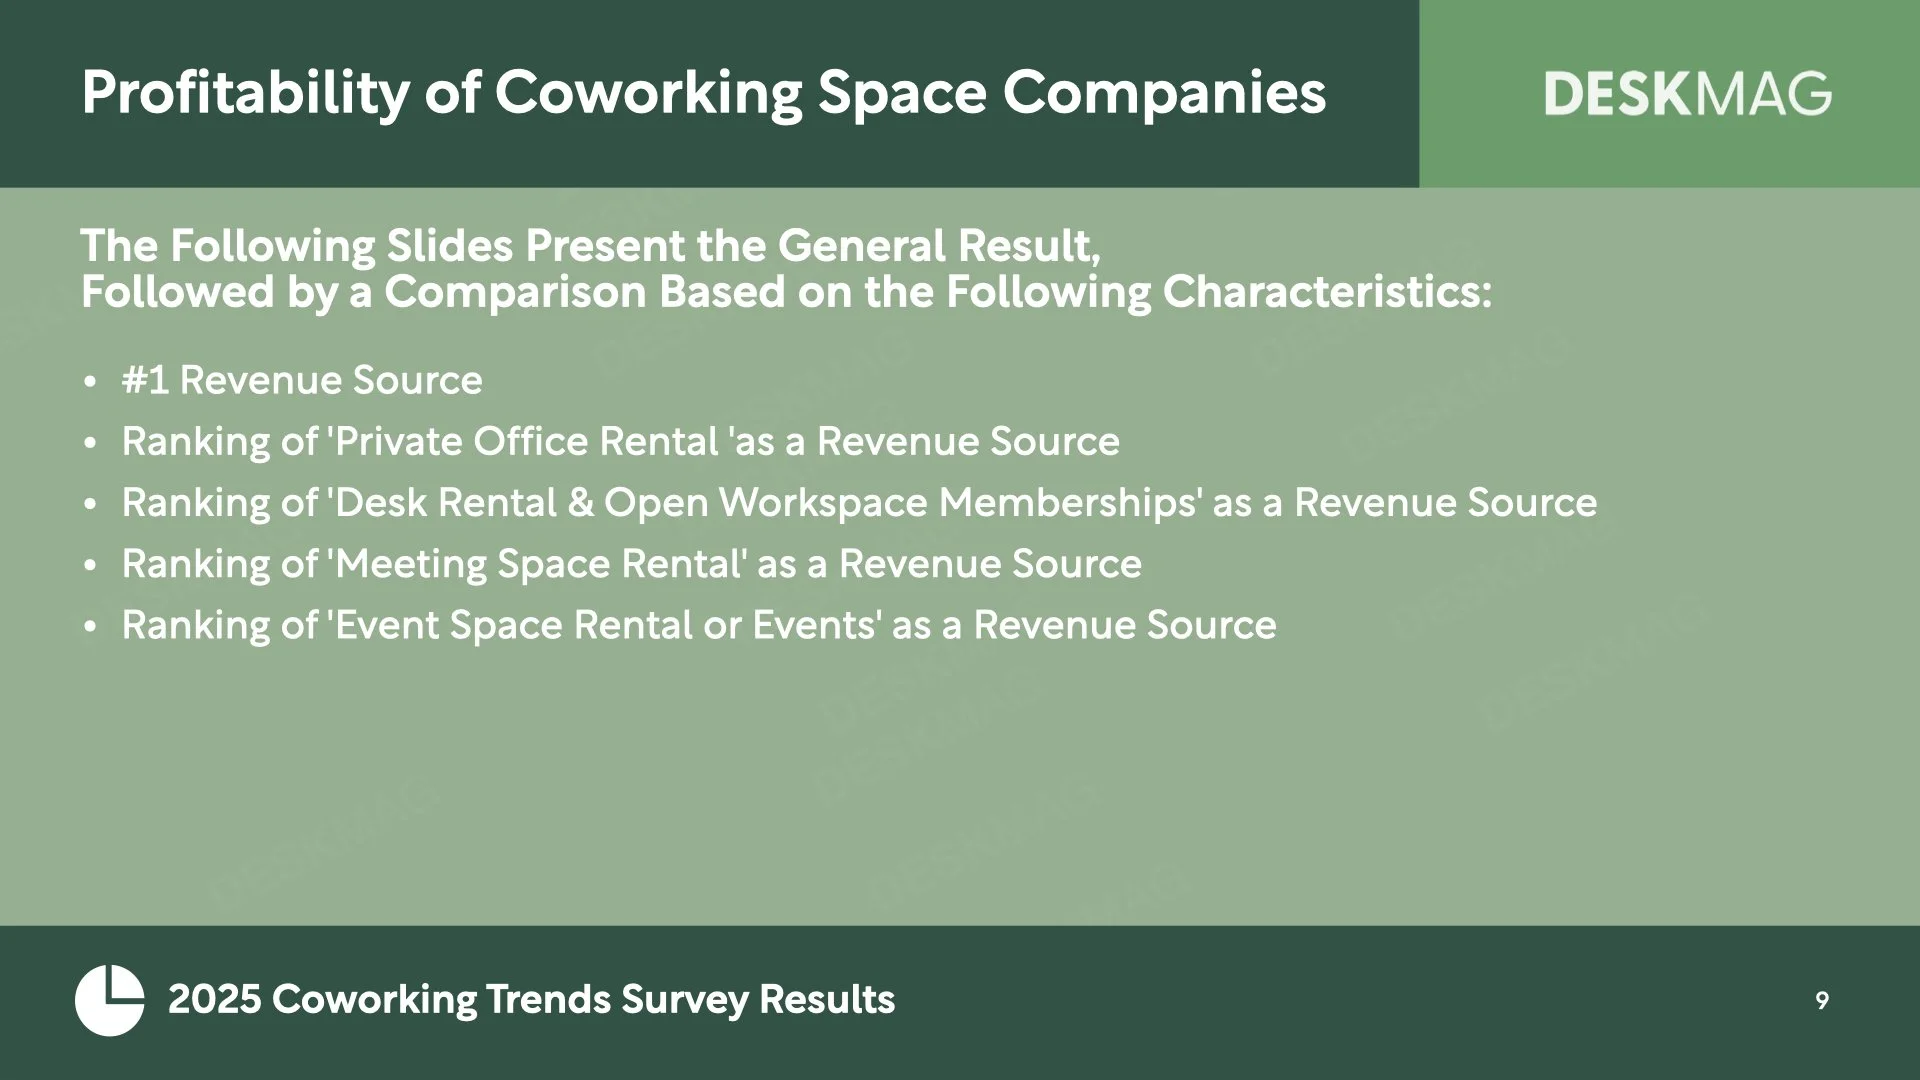
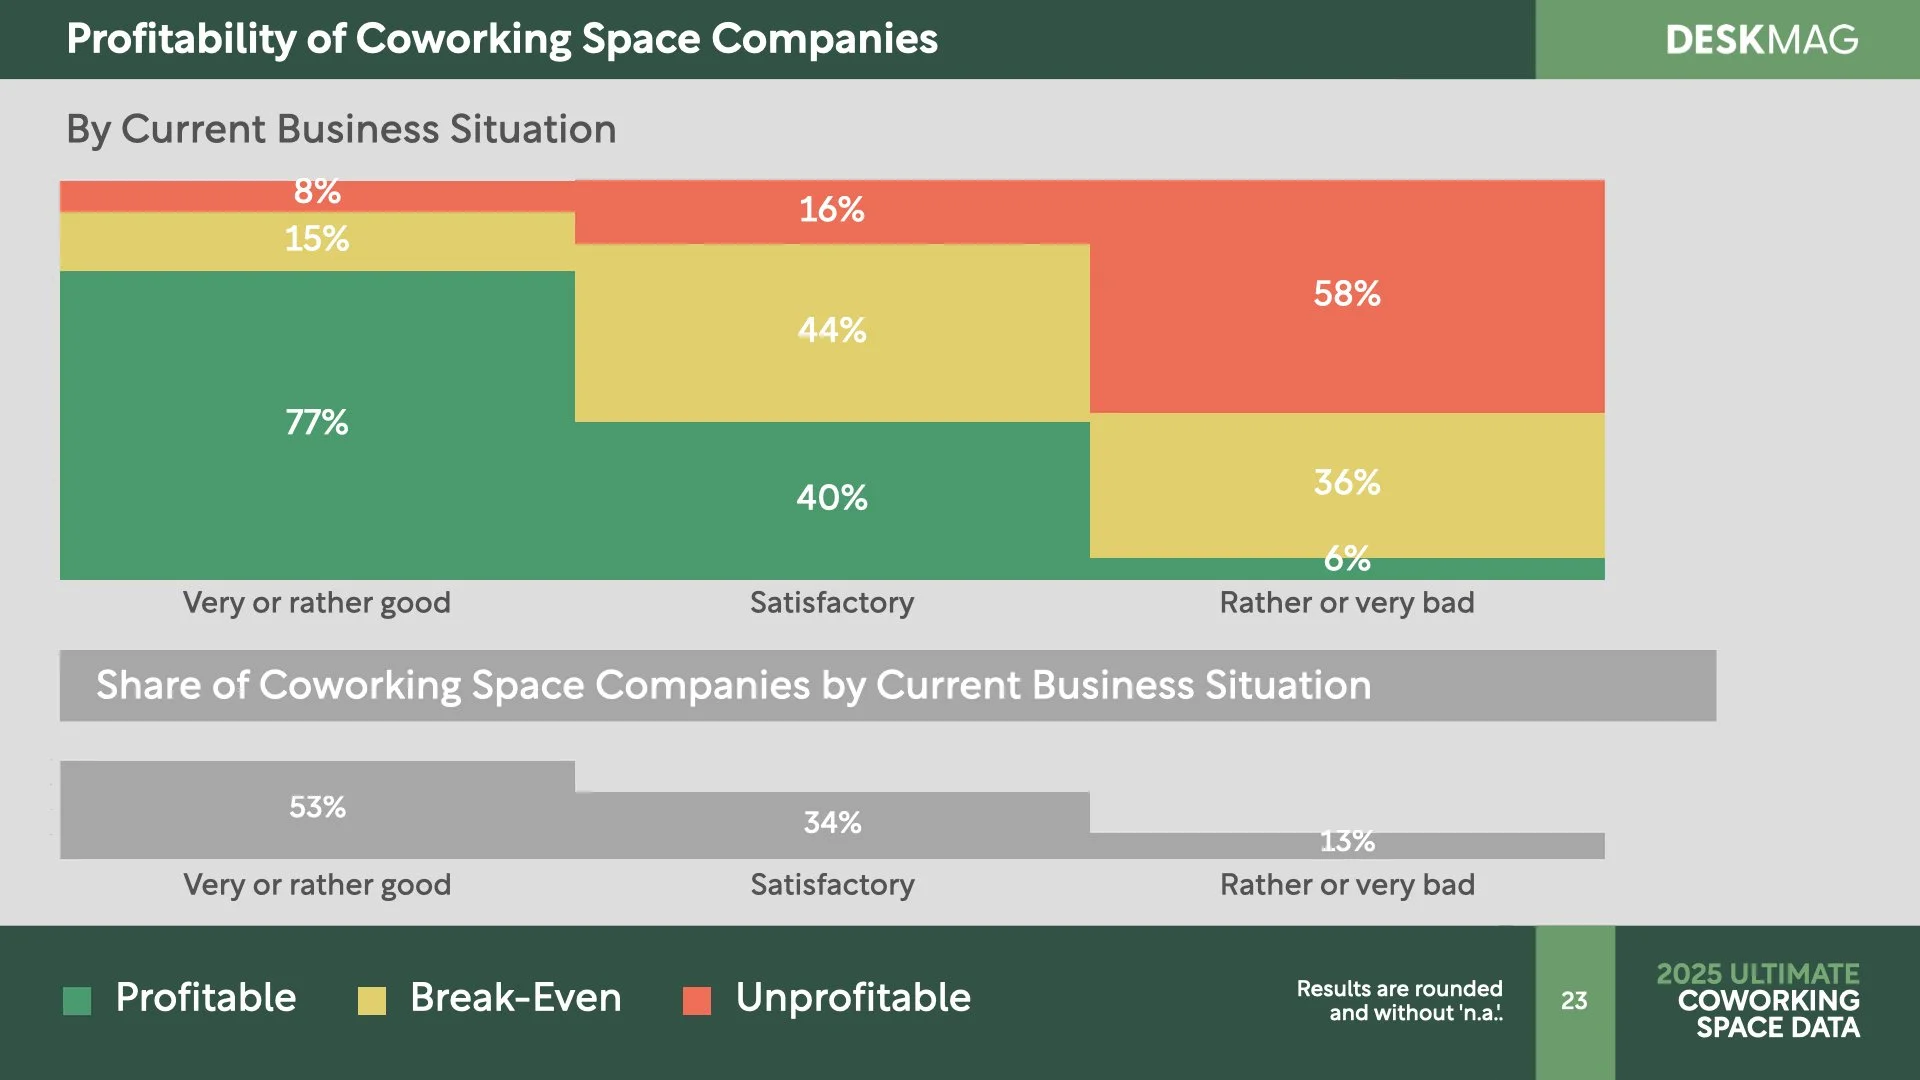
Profitability of Coworking Space Companies
Profitability of For-Profit Coworking Space Companies that are > 1 Year old
Average Number of Desks per Location
Average Size per Location in Square Meters
Average Size per Location in Square Feet
Average Size per Desk in Square Meters
Number of Locations of Coworking Space Companies
Age of Coworking Space Companies
Business Models of Coworking Spaces
Current Business Situation of Coworking Space Companies
Current Challenges of Coworking Space Companies
Current Economic Situation in operator's Region(s)
Average Vacancy Rates of Coworking Space Companiess
Average Revenue in Euro Countries & the U.S.
Top 3 Revenue Streams of Coworking Space Companies
Primary Financial Objectives of Coworking Space Companies
Other Primary Long-Term Goals of Coworking Space Companies
Characteristics of Coworking Space Locations
"Space-as-a-Service" Offerings of Coworking Space Locations
Average Employee Percentage Among Members per Location (Estimated)
Potential Maximum Exclusive Rental Share of Coworking Space Locations
Official Partners of the 2025 Coworking Trends Survey
Background: About the Survey Results
Citation Notes
1. Profitability of Coworking Space Companies - the results are compared by:
Year of survey
Year of survey (For-Profit Spaces only)
Average number of desks per location
Average size per location in m²/ ft²
Average size per desk in m²/ ft²
Age of coworking space company
Real estate ownership status of the location
Number of locations in operation
Business model
Main business approach
Current business situation
Current average vacancy rate
Current economic situation in operator's region(s)
Number of inhabitants* local to a space
Continent (Europe & North America)
#1 Revenue source
Ranking of 'private office rental 'as a revenue source
Ranking of 'desk rental & open workspace memberships' as a revenue source
Ranking of 'meeting space rental' as a revenue source
Ranking of 'event space rental or events' as a revenue source
2. Profitability of For-Profit Coworking Space Companies that are > 1 Year old - the results are compared by:
Average number of desks per location
Average size per Location in m²/ ft²
Average size per desk in m²/ ft²
Age of coworking space company
Real estate ownership status of the location
Number of locations in operation
Main business approach
Current business situation
Current average vacancy rate
Current economic situation in operator's region(s)
Number of inhabitants* local to a space
Rank of revenue source
3. Average Number of Desks per Location - the results are compared by:
Year of survey
Number of inhabitants* local to a space
Profitability over the past 12 months
Comparison of Averages Only:
Average size per location in m²/ ft²
Average size per desk in m²/ ft²
Age of coworking space company
Number of locations in operation
Business model
Main business approach
Continent (Europe & North America) and year*
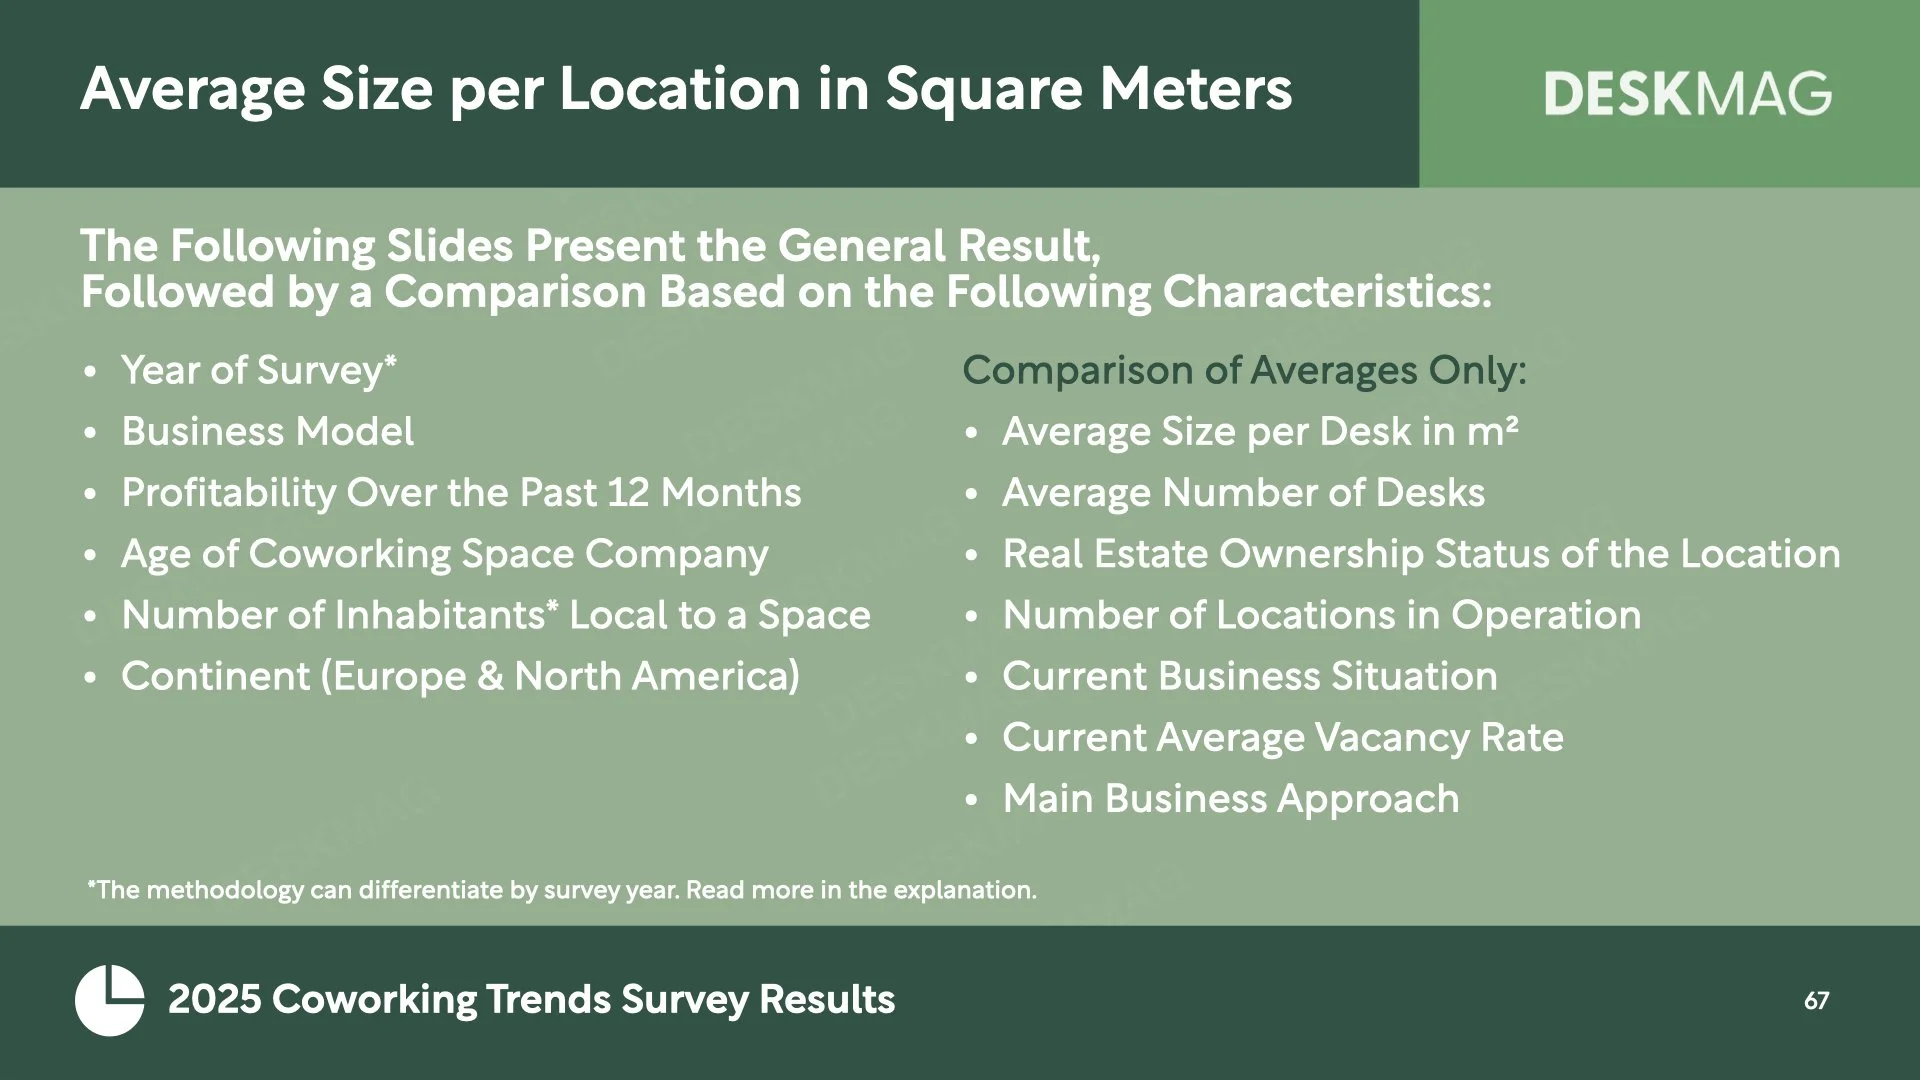
4. Average Size per Location in Square Meters - the results are compared by:
Year of survey
Business model
Profitability over the past 12 Months
Age of coworking space company
Number of inhabitants* local to a space
Continent (Europe & North America)
Comparison of Averages Only:
Average size per desk in m²
Average number of desks
Real estate ownership status of the location
Number of locations in operation
Current business Situation
Current average vacancy rate
Main business Approach
5. Average Size per Location in Square Feet - the results are compared by:
Year of survey* (2025 & 2023 only)
Business model
Profitability over the Past 12 Months
Age of coworking space company
Real estate ownership status of the location
Number of inhabitants* local to a space
Continent (Europe & North America)
Comparison of Averages Only:
Average size per desk in ft²
Average number of desks
Number of locations in operation
Current business Situation
Current average vacancy rate